India's ₹96 Rupee Pivot: Why FPIs Are Really Fleeing Indian Equities in 2026
Foreign ownership of Indian equities has fallen to a 14-year low while the rupee touched an all-time ₹96.84, but the two events aren’t as directly linked as the headlines suggest: valuation, earnings, and a global rotation into AI hardware are doing more of the work than currency alone.
What Actually Happened
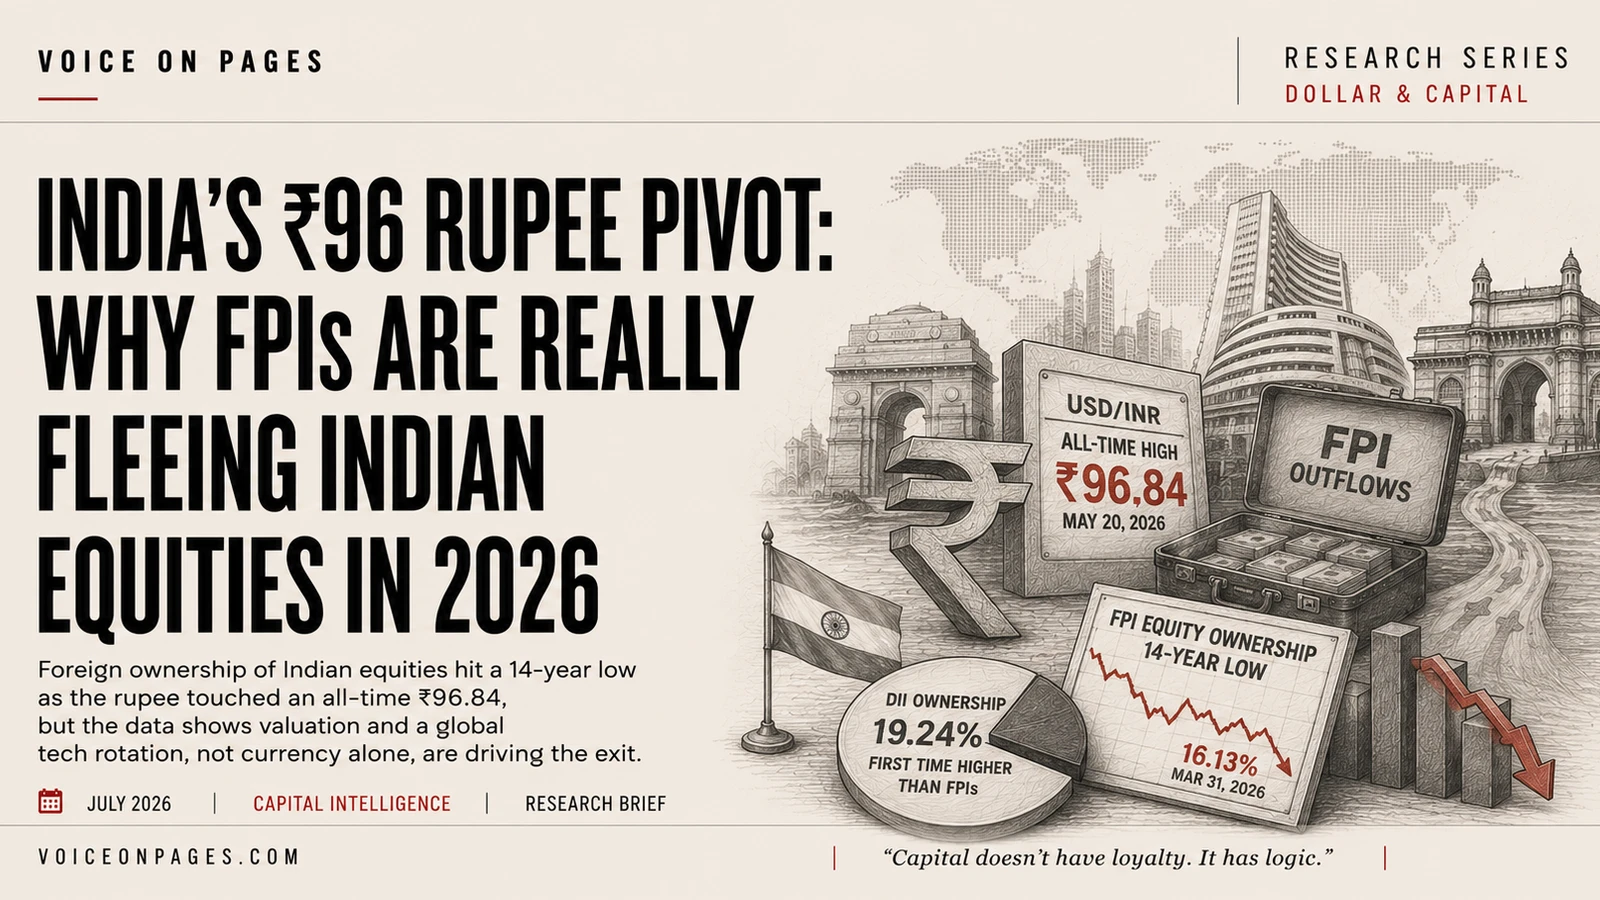
Three different trackers reported three different versions of the “14-year low” headline, and the gap matters for anyone building on this data. PRIME Database Group, measuring FPI holdings against the full NSE market capitalization, put foreign ownership at 16.13% as of March 31, 2026, down from 16.60% the prior quarter, the lowest since the September 2012 quarter. NSE’s own report, using a different scope, showed ownership falling 166 basis points over the fiscal year to 15.8%. JM Financial’s narrower monthly tracker, isolating a different stock basket, showed 14.7% for April 2026, the lowest since June 2012. None of these numbers is wrong; they’re measuring different baskets. The consistent signal across all three is the direction and the multi-year floor being broken, not a single precise percentage.
The more structurally significant number sits next to the FPI figure. By the same March 31, 2026 date, domestic institutional investors, mutual funds, insurers, banks, and pension funds combined, reached 19.24% ownership, officially overtaking FPIs for the first time in modern Indian market history. In June 2026, domestic mutual funds’ assets under custody, ₹76.41 lakh crore, surpassed FPI assets under custody, ₹76.22 lakh crore, for the first time on record.
The Rupee’s Actual Timeline
₹96 is not a projection. The rupee opened 2025 at ₹85.64, crossed ₹90 on January 2, 2026, and breached ₹91 within roughly 15 trading sessions on a $2.7 billion capital outflow. The US-Israel-Iran conflict that erupted February 28, 2026 accelerated the move: the rupee broke ₹93 for the first time in history on March 20, 2026, hitting an intraday low of ₹93.81 the same day FPIs liquidated more than $8 billion in equities. As Brent crude climbed past $100 a barrel, the rupee pushed through ₹95 in early May, touched an intraday low of ₹95.80 on May 13, and hit an all-time record intraday low of ₹96.84 on May 20, 2026. Through June and mid-July, it consolidated between ₹95.33 and ₹96.35, trading around ₹96.35 as of July 16.
Forecasts diverge sharply from here. Danske Bank, Goldman Sachs, and MUFG expect the rupee to hold a structurally weak ₹95-97 range through year-end. Bank of America and ING project appreciation back to ₹86-87 on a successful US-India trade deal. Algorithmic platforms like TradersUnion model continued depreciation toward ₹99.59 by end-2026. The range of expert opinion itself is a signal: nobody is confident this stabilizes soon in either direction.
The Selling Mechanics
FPI equity outflows accelerated through the same window: ₹35,962 crore out in January 2026, a brief ₹22,615 crore inflow in February, then ₹1,17,775 crore ($12.58 billion) out in March, the single heaviest month, tied by RBI commentary directly to the West Asia conflict and the trade deficit widening to $83.4 billion in Q4 FY26. Outflows moderated but stayed negative through April (₹58,869 crore), May (₹32,963 crore), and June (₹49,340 crore).
A mechanical amplifier ran alongside the macro shocks: the MSCI February 2026 review cut India’s weight in the Emerging Markets Index from a September 2024 peak near 20% to 14.1%, then to 11.94% by April 30, forcing passive funds to mechanically sell large-cap Indian holdings regardless of their own view on India’s prospects.
Hedging made the currency exposure worse to sit through, not easier to manage. The RBI capped onshore banks’ deliverable FX net open positions at $100 million per day on March 27, 2026, and banned onshore-linked NDF contracts for resident and non-resident clients on April 1. With forward premiums running near 3.5% and banks unwilling to quote tenors beyond two years, long-term hedges became largely uneconomical, leaving the bulk of FPI equity exposure unhedged and directly exposed to further rupee moves.
Why FPIs Say They’re Actually Selling
This is the piece that complicates the “escaping currency losses” framing. Geojit Investments’ V K Vijayakumar attributed the exit to rupee depreciation and slowing domestic earnings pushing capital toward markets with stronger near-term catalysts, specifically AI hardware. TrustLine Holdings’ N ArunaGiri noted that while South Korea and Taiwan pulled in $4 billion and $5.5 billion respectively in the same window, India failed to capture its usual share of regional allocation.
Academic research backs the “amplifier, not root cause” reading. An ARDL bounds-testing study covering 2011-2025 found a genuine long-run cointegrating relationship between FPI flows, Nifty valuations, and the exchange rate. But a separate 2026 study using Granger causality tests found the flows-to-returns causal link, while significant across the full 2020-2025 sample, weakened after 2023 and became statistically indistinguishable from zero in the 2025-only window, consistent with domestic institutional flows increasingly absorbing what foreign selling used to move on its own.
The Tax Matrix
India taxes listed equity gains on a 12-month holding threshold: 20% STCG and 12.5% LTCG at headline rates, but the real number is higher once a mandatory 4% cess and a surcharge (capped at 15% for equity) are added. Effective rates run 20.80% to 23.92% for STCG and 13.00% to 14.95% for LTCG.
| Jurisdiction | Non-resident listed equity CGT | Holding threshold | Notes |
|---|---|---|---|
| India | 20.80-23.92% STCG / 13.00-14.95% LTCG | 12 months | Surcharge capped at 15%; no indexation |
| United States | 0.00% | None | Non-resident aliens/foreign corps exempt if gains aren’t US trade-connected |
| Singapore | 0.00% | None | No domestic capital gains tax under territorial system |
| UAE | 0.00% | None | No personal or corporate tax on listed portfolio securities |
| Indonesia | 0.10% (final withholding, on gross sale value) | None | Flat transaction tax, no net-gain computation |
| Brazil | 15.00-22.50% withholding | None | Rises to flat 25% if investor is tax-haven domiciled |
| Saudi Arabia | 10.00% | None | Flat rate on non-resident transfers of listed shares |
The deeper issue isn’t the headline rate, it’s what India taxes. As a source-based (situs) system, India taxes the nominal rupee gain, with no adjustment for currency movement. Illustrative case: an investor deploying $100 at ₹85 who sees the asset appreciate in rupee terms while the currency depreciates to ₹95 books a 15% nominal rupee gain but only a 3% real dollar gain once converted back; the 12.5% LTCG applied to the nominal figure collapses the post-tax dollar return to roughly 1.3%. A residence-based system, by contrast, lets investors rotate between positions without a tax event at every trade; India’s situs system makes every single transaction taxable, penalizing exactly the kind of active rebalancing FPIs would otherwise do to manage risk.
The Mauritius and Singapore treaty routes that once let FPIs achieve a 0% effective rate were largely closed for new investment: shares acquired on or after April 1, 2019 get no treaty benefit, though shares acquired before April 1, 2017 remain grandfathered and exempt. A March 2024 protocol added a Principal Purpose Test to the India-Mauritius DTAA, and CBDT’s January 2025 guidance now requires FPIs claiming treaty benefits to demonstrate genuine economic substance, physical offices, local staff, resident directors, not just a registered address.
Where the Capital Actually Went
The exit wasn’t a generic flight from emerging markets, it was targeted. Taiwan’s equity market rallied 40% year-to-date in dollar terms and South Korea’s KOSPI surged 62%, both driven by foreign inflows chasing TSMC and Samsung’s direct exposure to the AI hardware buildout. India’s MSCI Emerging Markets weight fell to 14.1%, well behind China (26.58%), Taiwan (21.04%), and South Korea (15.65%).
This wasn’t a pure India story either. Brazil pulled in $89 billion in FDI in 2025, up 42%, on renewable energy and green-tech commitments, and Mexico’s FDI rose 16% to $44 billion on nearshoring. That capital is a different type (FDI, not portfolio flows) and chasing a different thesis, but it confirms emerging-market capital broadly kept moving in 2025-2026, just not toward Indian equities specifically.
The Counter-Narrative: Domestic Absorption
The scale of DII buying is the strongest argument against a “capital flight crisis” framing. DIIs posted ₹2.51 trillion in net Q1 2026 equity investment, more than offsetting FPI’s ₹1.41 trillion secondary-market outflow over the same period. That absorption was funded by SIP inflows that grew past ₹30,000 crore monthly by mid-2026, a genuinely new source of structural domestic demand that didn’t exist at this scale during the 2013 taper tantrum or the 2020 COVID shock.
Policy Response
Facing forex reserves that fell $5.65 billion to $666.93 billion in late June 2026, the government moved on debt markets specifically. An Income-tax Amendment Ordinance effective June 5, 2026 (retroactive to April 1) fully exempted FPI interest income and capital gains on government securities, eliminating the 20% withholding tax and 12.5% LTCG that had made Indian G-Secs structurally unattractive to index funds like JPMorgan’s GBI-EM tracker. The move triggered over ₹55,518 crore in general-route and ₹21,652 crore in Fully Accessible Route passive debt inflows in June alone. The RBI separately subsidized FCNR(B) deposit hedging costs and waived SLR/CRR requirements on them through September 30, 2026, cutting banks’ effective cost enough to offer non-residents 5.5%+ dollar deposit rates, a roughly 150 basis point pickup over US Treasuries.
Notably, none of these interventions touched equity capital gains tax. The relief went to debt markets, not the equity outflow this article is centered on.
The Bottom Line
Two credible readings of this data exist side by side. The bull case treats the sell-off as a healthy valuation reset: by July 2026, Nifty 100 forward P/E had compressed to 20.7x against a 24.4x historical median, while FY26 GDP grew an estimated 7.6% and Nifty 500 earnings rose 7%, an entry point argument for whenever rates ease and the rupee stabilizes. The skeptic case treats it as structural: source-based taxation on nominal gains, tightened treaty rules, and new UBO disclosure requirements are self-inflicted friction that a cyclical rebound won’t fix on its own. Both readings agree on the same underlying fact: this was never a simple currency story. It was valuation, earnings, a global AI-hardware rotation, and tax friction moving together, with the rupee’s collapse to ₹96 as the most visible symptom rather than the root cause.
Sources: PRIME Database Group, NSE, JM Financial, Reuters, TradingEconomics, NSDL, SEBI, RBI, Ministry of Finance ordinances, UNCTAD Global Investment Trends Monitor, Geojit Investments, TrustLine Holdings, verified via Gemini Deep Research, July 2026.
SOURCES
- FPI ownership of Indian equities hits 14-year low as selling streak continues — The Hindu BusinessLine
- FPI equity ownership plunges to 14-year low of 16.13% in FY26 — The New Indian Express
- Indian Rupee - Quote, Chart, Historical Data — Trading Economics
- Rupee eyes reprieve as lukewarm jobs report pushes back Fed hike wagers — Reuters
- Rupee's RBI defense line at risk as US yields rise, Asian peers weaken — Reuters
KEY TAKEAWAYS
- FPI equity ownership in Indian companies fell to a 14-year low, 16.13% by PRIME Database's measure as of March 31, 2026 (15.88% and 14.7% on narrower index-specific trackers), while domestic institutional investors overtook foreign investors in ownership share for the first time, reaching 19.24%.
- The USD-INR rate is not a forecast at ₹96, it is a realized spot move: the rupee fell from ₹85.64 in January 2025 to an all-time intraday low of ₹96.84 on May 20, 2026, before consolidating in the ₹95.33 to ₹96.35 range through July.
- FPIs pulled a net ₹1.66 lakh crore ($18.4 billion) from Indian equities in calendar 2025, exceeding the entire 2022 global tightening cycle outflow, with the single heaviest month, March 2026's ₹1.17 lakh crore ($12.58 billion), tied directly to the West Asia conflict and Brent crude crossing $112.
- Named strategists and flow data both point to valuation compression, slowing earnings, and a global AI-hardware reallocation toward Taiwan (+40% YTD in dollar terms) and South Korea (+62% YTD) as the primary drivers, with rupee depreciation acting as an amplifier rather than the root cause.
- India taxes FPI capital gains on a source-based (situs) system at effective rates up to 23.92% STCG and 14.95% LTCG including surcharge and cess, versus a 0% non-resident capital gains rate in the US, Singapore, and UAE, a structural gap the government partially closed in June 2026 by fully exempting FPI income and gains on government bonds.
- Domestic institutional investors, powered by SIP inflows exceeding ₹30,000 crore a month, posted ₹2.51 trillion in net Q1 2026 equity buying, fully offsetting FPI's ₹1.41 trillion outflow and preventing the systemic price collapse a foreign exodus this size would historically have caused.
READ THE RESEARCH BRIEF
Receive one institutional-grade research briefing every week. No clickbait. No spam. Just signal.
READ NEXT