The Hormuz Bottleneck: How a Live Blockade Already Hit India's Economy in 2026
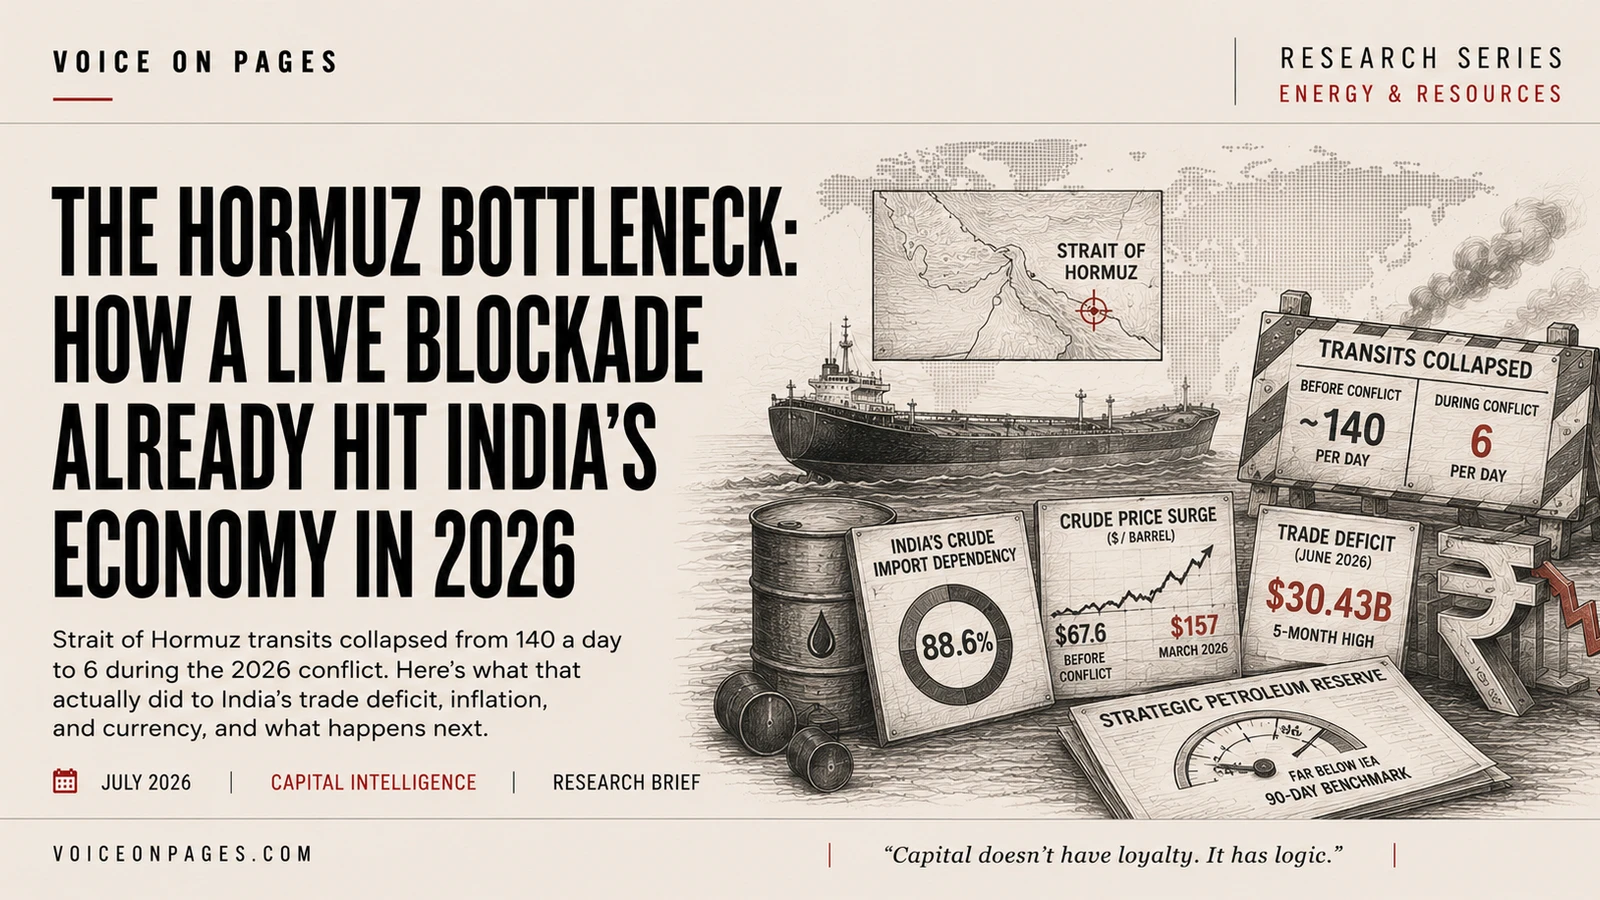
A conflict that began Feb. 28, 2026 turned the Strait of Hormuz from a theoretical chokepoint into an active one, cutting daily vessel transits from around 140 to a record 6, and the trade, currency, and inflation damage to India’s economy is already measurable rather than modeled.
What Actually Happened
The crisis is not hypothetical and it is not over. Active hostilities between the United States and Israel on one side and Iran and its regional proxies on the other began Feb. 28, 2026. A ceasefire negotiated at a Geneva summit on June 21 established a 60-day window starting June 15, but it collapsed in early July when President Trump declared the truce over and resumed strikes on Islamic Revolutionary Guard Corps positions and commercial shipping lanes. Iran responded by declaring control over the Strait of Hormuz and closing it to commercial vessels, while the US conducted contested naval operations to keep a navigation lane open along Omani waters.
Brent crude’s path through this tracks the conflict almost tick for tick. India’s own crude basket averaged a comfortable $67.6 a barrel over the first eight months of FY26. After Feb. 28, global benchmarks surged; the Indian basket hit a historic peak of $157 a barrel in March 2026. Prices moderated to a cycle peak of $126 in April, settled near $118, then averaged $107.55 (Brent) in May. The June ceasefire briefly dragged Brent to $72, with the full month averaging $85.47. When the truce collapsed in July, Brent jumped 10% in a single session past $84 and has since traded in a volatile $79-85 band, which happens to sit almost exactly where your “de-escalation” scenario would put it, not because the conflict de-escalated, but because markets are currently pricing a fragile, contested equilibrium rather than either resolution or catastrophe.
The Baseline Numbers
Before assessing damage, the structural exposure needs precise figures, not round ones. India’s crude oil import dependency ratio stands at 88.6-88.7% (PPAC), with domestic production actually declining at a -2.67% CAGR from 2014-2023. LPG import dependency is 60% and LNG roughly 50%.
The Hormuz-specific exposure is what makes this chokepoint different from a generic oil-price shock. Approximately 40% of India’s total crude imports were linked to Hormuz transit before the conflict, but that aggregate undersells regional concentration: nearly 50% of India’s crude imports came from the Persian Gulf specifically via Hormuz. The exposure is far worse for household fuel: 90% of India’s imported LPG, which supplies over half of domestic household cooking fuel, transited the Strait, along with roughly 60% of LNG imports.
The financial sensitivity is well documented and, unusually for this kind of claim, consistent across independent sources. Every $1 a barrel increase in crude prices raises India’s gross annual import bill by roughly $1.8-2 billion. Nomura’s research shows every 10% increase in crude prices widens India’s CAD by about 0.4% of GDP; ICRA’s model independently arrives at the same 0.4% of GDP for every $10 a barrel absolute increase in Brent. Two different institutions, two different framings, the same coefficient.
What Actually Happened to the Trade Balance
Here is where the story gets genuinely counterintuitive. India’s current account was in solid shape heading into the conflict: H1 FY26 CAD fell to 0.8% of GDP from 1.3% the year before, and Q3 FY26 (through December 2025, pre-conflict) stood at 1.3-1.5% of GDP.
Then the conflict hit in Q4 FY26 (January-March 2026), and the current account posted a surplus of $7.1 billion, 0.7% of GDP, even as the merchandise trade deficit widened sharply to $83.4 billion from $59.3 billion a year earlier. The surplus wasn’t good news arriving early; it was a lagging indicator. A remittance windfall of $41.3 billion and strong services exports of $60.4 billion masked the damage for one quarter, because the physical import pipeline was still executing crude contracts locked in before prices spiked in late February.
The real cost showed up with a lag through the following months. India’s merchandise trade deficit hit $18.38 billion in April, driven by a 53% month-on-month jump in crude import volumes as refiners panic-bought to secure supply, plus an 84% spike in gold imports as a currency hedge. It widened to $28.2 billion in May as the high-priced March crude cleared customs, then to a five-month high of $30.43 billion in June, with gross imports up 31% and export growth capped at 15.5%.
The Real Hormuz Disruption
This is the part that separates 2026 from every prior “chokepoint risk” article: actual kinetic disruption occurred, not just elevated insurance premiums. Iran struck two ADNOC-operated Very Large Crude Carriers with cruise missiles in the southern shipping lane, causing one confirmed fatality and effectively halting commercial traffic in that lane. Daily vessel transits, which averaged up to 140 pre-war and 40-50 during the brief post-ceasefire window, fell to a record low of just 6 at the crisis’s worst point.
By July 2026, more than 200 non-Iranian vessels were coordinating directly with a newly established Persian Gulf Strait Authority in Tehran to receive transit permits and sovereign insurance, a de facto Iranian permitting regime replacing open transit. Ships bound for India accounted for 20% of approved outbound applications, second only to China’s 21%. At least nine Indian-flagged vessels carrying crude and LPG, with 198 mariners aboard, were stranded in the Persian Gulf awaiting clearance, and three Indian seafarers were killed in US strikes on commercial shipping in the Gulf of Oman in June.
The Inflation and Currency Transmission
Two channels carried the shock into household prices. Under the direct channel, OMCs bidding for dollars to cover the import bill widen the trade deficit and pressure the rupee; under the capital channel, geopolitical risk-off sentiment drove FPIs to pull $16.4 billion from Indian markets in FY26, $12 billion of it in the Q4 conflict quarter alone. The rupee depreciated roughly 9% over FY26 to close near ₹93.88 in late March, hit a record intraday low of ₹95.63 on May 13, and approached ₹96 by mid-July. The RBI sold a net $50.8 billion between April 2025 and January 2026 to smooth the move, draining reserves from a $728.49 billion peak to $700.9 billion by April.
The RBI’s own Recalibrated Quarterly Projection Model (QPM 2.0) puts the pass-through at roughly 30 basis points of peak headline CPI for every 10% rise in international crude prices; Bank of Baroda’s separate analysis finds a 10% rupee depreciation adds another 30-35 basis points via imported cost-push inflation. Fuel carries a 7% CPI weight, and June 2026 headline CPI hit a 17-month high of 4.38%, breaching the RBI’s 4% target, with the transport and communication CPI component surging from 1.75% in May to 4.30% in June.
The government tried to absorb the shock rather than pass it through immediately. Retail petrol and diesel prices were frozen for 76 days starting in March, funded by a ₹10/litre central excise cut on March 27 that cost the exchequer an estimated ₹1.1 lakh crore (about $12 billion), per SBI. Oil marketing companies absorbed the gap instead: daily under-recoveries hit ₹2,400 crore the day the excise cut took effect, and per-litre losses peaked at ₹105 on diesel. The freeze lifted May 15, followed by four cumulative hikes passing roughly ₹7.5/litre back to consumers.
The Reserve Gap
India’s Strategic Petroleum Reserve exists precisely for a scenario like this one, and its limits are exposed by it. Phase I’s three underground caverns (Padur, Mangaluru, Visakhapatnam) hold a combined 5.33 million metric tonnes, about 39 million barrels, enough for 9.5 days of net imports if completely full. As of early 2026, the SPR sat at only 64% capacity, roughly 3.37 MMT, good for just 5 days of cover. Including commercial inventories held by oil marketing companies, India’s total national stock position reaches 74-76 days, still short of the IEA’s 90-day standard for full members (India is only an associate member). In an acute emergency, the government estimates the combined system could stretch to roughly 8 weeks.
Phase II expansion, a 4.0 MMT cavern at Chandikhol and a 2.5 MMT extension at Padur that would add 6.5 MMT and push strategic cover to about 22 days, has been approved but underfunded: the FY26 budget allocated ₹5,597 crore to ISPRL, and revised estimates slashed actual capex by 79% to just ₹870 crore.
Where This Goes From Here
Three forward paths exist from the current $79-85 baseline, and unlike a purely hypothetical exercise, two of them are already partially validated by what’s happened so far.
| Scenario | Brent range | Basis | India CAD impact |
|---|---|---|---|
| De-escalation | $70-90/bbl | IEA/EIA base case; expanding non-conflict supply (US shale, Norway, Canada), OPEC+ easing, softening demand | Narrows back to 1.0-1.3% of GDP |
| Prolonged low-level conflict | $90-100/bbl | Crisil projects $90-95 average, a 32% YoY rise; Goldman Sachs projects ~$90 for CY2026 | Crisil: widens to 2.2% of GDP; Goldman: 1.7% for FY27 |
| Extended/total closure | $150-200+/bbl | Deutsche Bank: 2-month closure pushes prices above $120 instantly; IEA/Rabobank extreme case models $150-200 as inventories and OPEC spare capacity exhaust | Annual import bill up $100B+; CAD pushed past 4.5% of GDP |
Lombard Odier’s John Woods flags a more durable middle-ground risk: a $5-15/barrel structural risk premium likely gets permanently embedded in global prices even after active hostilities end, simply because markets have now repriced Hormuz transit risk and won’t fully unprice it. The Dallas Fed’s DSGE modeling for a three-quarter closure scenario puts WTI at $167 and US headline PCE inflation up 1.47 percentage points, giving a sense of scale even for an economy far less import-dependent than India’s.
History offers a partial anchor against the worst case. During the 1980s Tanker War, 411 merchant vessels were attacked and shipping fell 25%, yet the Strait was never fully closed; shippers adapted through naval escorts, insurance premiums rose only 2%, and the amortized cost added just $1.20/barrel. The 2024 Red Sea Houthi disruption is a closer recent analogue: it redirected shipping and spiked freight costs without a physical supply shutdown. Full, sustained closure of Hormuz, blocking 16-18 million barrels a day, remains a scenario every institution treats as extreme rather than base case, precisely because it has never actually happened even during prior Gulf conflicts.
How India Rewired Its Supply Chain in Real Time
The clearest evidence India isn’t simply absorbing this shock is the sourcing shift. Pre-crisis (Q1 2026), Iraq led India’s crude basket at 19.89% share, followed by Russia (17.92%), Saudi Arabia (16.03%), and the UAE (11.00%). By July 2026, that basket had been rewritten: Russian crude, arriving via Baltic and Pacific routes that bypass Hormuz entirely, surged to roughly 49-50% of total imports. Iraq, Kuwait, and Qatar, suppliers with no alternative transit routes, collapsed to under 1% each. Saudi Arabia partially recovered from a 7% low to around 10% by routing crude via its East-West Petroline to the Red Sea port of Yanbu, cutting its August Arab Light price by $11/barrel, its largest cut in two decades, to defend market share. The UAE shifted some volume through its Abu Dhabi Crude Oil Pipeline to Fujairah, though that route’s spare capacity is limited to roughly 700,000 barrels a day. Venezuela, whose heavy sour crude suits India’s upgraded west coast refineries, rose to a 7% share via the Cape of Good Hope route. Total crude imports still contracted to about 4.55 million barrels a day in July, down from 5.09 million in June, reflecting that rerouting has limits even when it works.
Kotak Securities’ Anindya Banerjee points to a separate cushion arriving in August-September: an anticipated $50 billion capital inflow via FCNR(B) deposits and external commercial borrowings, enough to cover three to four months of India’s average monthly crude import bill.
The Bottom Line
The Hormuz risk this article was originally framed to model has already been stress-tested by an actual conflict, and the results are mixed rather than catastrophic. India avoided a full CAD blowout partly through lagging remittance and services flows, partly through an unprecedented pivot to Russian crude that most models wouldn’t have assumed was available at this scale, and partly because the Strait was never fully and permanently closed even during its worst six-transits-a-day week. What the data does confirm is that the confirmed sensitivity coefficients, roughly 0.4% of GDP in CAD and 30 basis points of CPI for every $10 and 10% move respectively, held up under live conditions, and that India’s actual strategic reserve buffer, 5 days at current fill, is far thinner than the headline 39-million-barrel capacity implies. Because in the end, capital doesn’t have loyalty. It has logic, and right now that logic is routing an unprecedented share of India’s oil through Russian pipelines that didn’t carry this much of India’s energy security a year ago.
Sources: Petroleum Planning and Analysis Cell, Reserve Bank of India, Ministry of Statistics and Programme Implementation, Nomura Global Markets Research, ICRA, Crisil, Goldman Sachs, Deutsche Bank, IEA, Federal Reserve Bank of Dallas, State Bank of India ECOWRAP, Kotak Securities, verified via Gemini Deep Research, July 2026.
SOURCES
- The Strait of Hormuz in 8 Charts — CSIS
- Iran Shipping Update - July 1, 2026 — United Against Nuclear Iran (UANI)
KEY TAKEAWAYS
- India imports 88.6-88.7% of its crude oil, and before the 2026 conflict roughly 40-50% of that crude, along with 90% of LPG and 60% of LNG, transited the Strait of Hormuz, per Petroleum Planning and Analysis Cell data.
- This was not a hypothetical stress test: daily Hormuz vessel transits collapsed from a pre-war average near 140 to a record low of 6 during the worst of the conflict, following confirmed Iranian missile strikes on ADNOC tankers and the deaths of Indian seafarers.
- The Indian crude basket price rocketed from $67.6 a barrel before the conflict to a historic $157 a barrel in March 2026, while India's merchandise trade deficit widened progressively to a five-month high of $30.43 billion by June, even as a temporary Q4 current account surplus (0.7% of GDP) briefly masked the damage through a remittance windfall.
- The core sensitivity figures your finance desk would want are confirmed by two independent sources: every $10 a barrel Brent increase widens India's CAD by roughly 0.4% of GDP (ICRA, Nomura), and every 10% oil price rise adds about 30 basis points to peak headline CPI, per the RBI's own QPM 2.0 model; June 2026 CPI hit 4.38%, breaching the RBI's 4% target.
- India's Strategic Petroleum Reserve covers only about 5 days of imports at its actual 64% fill level, far short of the IEA's 90-day benchmark, and Phase II expansion funding was cut 79% in FY26 revised estimates.
- India rewired its crude sourcing in real time during the crisis: Russian imports surged to roughly 49-50% of the total basket by July 2026 via Baltic and Pacific routes that bypass Hormuz entirely, while Iraq, Kuwait, and Qatar collapsed to under 1% each.
READ THE RESEARCH BRIEF
Receive one institutional-grade research briefing every week. No clickbait. No spam. Just signal.
READ NEXT