Global Debt Hit a Record $348 Trillion as the US Faces a $9.3 Trillion Refinancing Wall in 2026
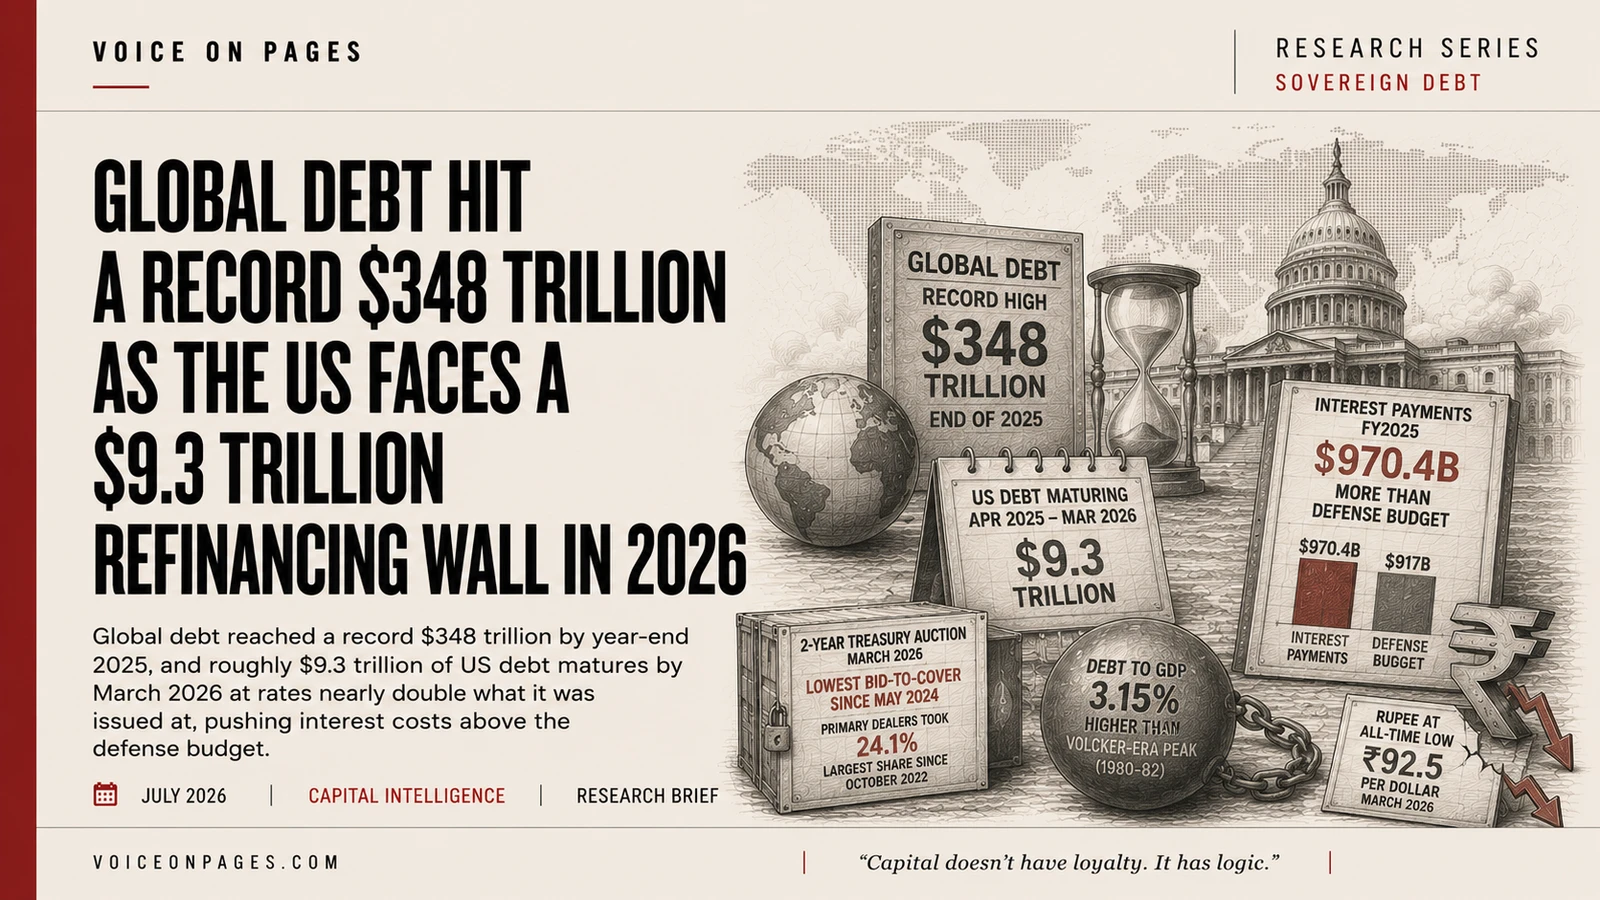
Global debt reached a record $348 trillion by the end of 2025 and is heading past $350 trillion in 2026, while roughly $9.3 trillion of US government debt matures by March 2026 and must be refinanced at rates about 3 percentage points higher than when it was issued.
What Actually Happened
The often-cited $346 trillion figure for global debt was already out of date the moment it started circulating. That number reflected a Q3 2025 snapshot from the Institute of International Finance. By year-end 2025, the IIF’s Global Debt Monitor put total global debt at a record $348 trillion, and its early-2026 tracking showed the figure nearing $353 trillion, with global debt-to-GDP sitting around 305 percent.
The more immediate pressure point is the United States. The Peter G. Peterson Foundation estimates that about $9.3 trillion, roughly a third of all debt held by the public, matures between April 2025 and March 2026. A separate market estimate puts $9.2 trillion maturing in calendar year 2025 alone, close to 30 percent of US GDP. Much of this stock was issued at an average coupon near 2.5 percent or lower. It is now rolling into a market where the average interest rate on marketable debt has climbed to about 3.35 to 3.37 percent, and the 10-year Treasury yield sits around 4.6 percent. That is roughly a 3 percentage point jump in borrowing cost for every dollar refinanced, translating to about $30 billion in additional annual interest for every trillion dollars rolled from pandemic-era rates into today’s market.
This is not a future risk. It has already shown up in the federal budget. Net interest payments reached $970.4 billion in fiscal year 2025, up from $881.7 billion in 2024, and that figure exceeded the $917 billion national defense budget for the full fiscal year. The pattern held into fiscal 2026: in the first quarter (October through December 2025), net interest payments were $270.3 billion against $266.9 billion for defense. The United States is now spending more to service its debt than to defend itself, on both an annual and a quarterly basis.
The Buyer Problem: Who Is Still Showing Up
A refinancing wall only becomes a trap if demand cannot absorb the supply. Through early 2026, demand held up reasonably well at the benchmark maturities. A January 2026 10-year note auction showed a six-month average foreign and indirect bidder share of about 69.5 percent, with primary dealers absorbing only around 10 percent, a sign that outside buyers were still doing most of the work.
That changed at the shorter end in March. A two-year note auction on March 24, 2026, offering $69 billion, came in notably weak. The bid-to-cover ratio fell to 2.44, the lowest since May 2024. Direct bidder participation collapsed to about 16.5 percent from 42.3 percent the prior month. Indirect bidders, largely foreign reserve managers, took roughly 60 percent, but that was not enough to offset the drop in direct demand. Primary dealers, the buyers of last resort, were forced to absorb about 24.1 percent of the auction, up from roughly 9.8 percent the month before and their heaviest share since October 2022.
| Auction | Date | Bid-to-Cover | Direct Bidders | Indirect Bidders | Primary Dealers |
|---|---|---|---|---|---|
| 10-year note (6-month avg) | Jan 2026 | Not specified | Not specified | ~69.5% | ~10% |
| 2-year note | Feb 2026 | Not specified | 42.3% | Not specified | ~9.8% |
| 2-year note | Mar 24, 2026 | 2.44 (lowest since May 2024) | ~16.5% | ~60% | 24.1% (heaviest since Oct 2022) |
This was not a failed auction in the formal sense, but it is the clearest evidence yet that private dealers are being pulled in to fill gaps that used to be covered by direct buyers, exactly the dynamic that turns a large maturity wall into a genuine funding strain.
The Volcker Parallel: A Worse Number, a Bigger Base
The closest historical comparison is the Volcker-era rate shock of 1979 to 1981, the last time the US faced a comparable reset in refinancing costs. Federal Reserve Economic Data shows interest outlays climbing from about 1.62 percent of GDP in 1979 to 1.84 percent in 1980, 2.14 percent in 1981, and 2.54 percent by 1982 as Volcker’s rate hikes worked through the existing debt stock. Budget records later showed net interest rising from roughly 2.0 to 3.4 percent of GDP between 1980 and the early 1990s.
By that same interest-cost-to-GDP measure, 2025 already stands at 3.15 percent of GDP, above the entire 1980-82 Volcker-era peak and closing in on the early-1990s high of around 3.2 percent. The critical difference is the size of the debt base carrying that burden. In 1980, debt held by the public was under 30 percent of GDP. Today it is well above 100 percent and still rising, meaning a comparable rate structure now presses on a debt base several times larger relative to the economy than the one Volcker was working against.
India’s Angle: Defending the Rupee While Repositioning Away From Treasuries
For India, the global refinancing story is showing up directly in currency management. The RBI net sold $31.98 billion in the spot market between January and October 2025 to defend the rupee, compared with being a net buyer of $23.03 billion over the same period in 2024. Gross spot sales over that window reached about $207.96 billion, up 35 percent year over year, indicating heavy two-way intervention with a clear net-sale bias. On the forward side, the RBI’s outstanding net forward dollar sales rose to $88.75 billion in February 2025 from $77.52 billion in January, shifting more of the defense into forwards. In one August 2025 episode alone, the RBI sold more than $5 billion across onshore and offshore markets in a single week, draining $9.3 billion from FX reserves.
By March 2026, the cumulative effect showed up in the reserve numbers: FX reserves fell from around $591 billion to about $563 billion, with the forward book still running roughly $67.8 billion short. Despite the intervention, the rupee continued to weaken, touching a fresh record low near 92.5 per dollar in mid-March 2026.
At the same time, India has been trimming its exposure to the asset at the center of the global refinancing story. US Treasury data summarized by Indian media shows India’s Treasury holdings fell from $225.7 billion in January 2025 to $182.9 billion by December 31, 2025, a reduction of $42.8 billion, about 19 percent, in a single year. A separate reading of the same TIC data frames it as a 21 percent drop, from $241.4 billion in October 2024 to $190.7 billion in October 2025. The RBI governor has publicly stated there is “no reduction” in holdings relative to then-current levels, but that comment sits on top of cuts that had already pushed India’s Treasury exposure to a five-year low. Taken together, the earlier estimate of roughly a $50 billion reduction still holds directionally, even as reserves overall remain strong.
Who Benefits, and Who Doesn’t
Every large structural story has a counter-flow, and this one is no exception. A Bank for International Settlements review from March 2026 found that as markets rotated away from US assets, investors extended their search for yield into emerging market debt, fueling rallies in EM sovereign and corporate bonds, particularly among commodity-exporting economies. Morgan Stanley Investment Management has called the 2026 outlook for emerging market debt “bright,” citing eased inflation, attractive real yields, and $13.2 billion of inflows into EM debt in late 2025 alone.
Two caveats are worth stating honestly rather than glossing over. First, the evidence for Gulf sovereign wealth funds specifically rotating out of Treasuries into alternative assets is thin in the available 2025-26 coverage; the emerging market rotation is better documented among asset managers, insurers, and non-bank investors broadly. Second, India itself does not appear in the available research as a named, primary destination for these reallocated flows, the way commodity-exporting regions or parts of Latin America do. India benefits from the broader emerging market debt rally as part of that universe, but the data does not support singling it out as the standout winner.
The Corporate Echo: The Same Wall Sits Inside Private Balance Sheets
The refinancing pressure is not confined to governments. S&P Global Ratings estimates $12.1 trillion of rated corporate debt, bonds, loans, and revolvers, is maturing globally between mid-2021 and the end of 2026, with a back-loaded profile as companies that extended tenors during the zero-rate era now face a genuine refinancing hump. In the United States alone in 2025, Trepp’s maturity-wall analysis shows $7.3 trillion of Treasuries, $951 billion of corporate debt, and $660 billion of commercial and multifamily real estate mortgages coming due. Over 2025-29, Trepp projects $6.3 trillion in corporate bonds and $3.2 trillion in CRE debt maturing, with the corporate hump intensifying into 2026-28, especially for lower-rated borrowers.
Roughly half of speculative-grade debt maturing between April 2025 and the end of 2026 is concentrated in just three sectors: healthcare, media and entertainment, and telecom, according to S&P Global data cited in market research. That concentration means the refinancing squeeze will not land evenly. It will show up first and hardest in a small number of industries already carrying weaker credit profiles.
Quick Answers to Common Questions
How much is global debt in 2026? The Institute of International Finance put global debt at a record $348 trillion at the end of 2025, and its tracking suggested the figure was nearing $353 trillion in early 2026, with debt-to-GDP around 305 percent.
How much US debt is maturing in 2025-2026? The Peter G. Peterson Foundation estimates about $9.3 trillion, roughly a third of all debt held by the public, matures between April 2025 and March 2026, most of it originally issued at rates well below 2 percent.
Does the US now pay more in interest than on defense? Yes. Net interest payments reached $970.4 billion in fiscal year 2025, above the $917 billion defense budget, and interest again exceeded defense spending in the first quarter of fiscal year 2026.
Why is the Reserve Bank of India selling dollars? The RBI has been selling dollars from its reserves to slow the rupee’s decline, net selling about $32 billion in the spot market between January and October 2025, even as the rupee still touched a record low near 92.5 per dollar in March 2026.
Is today’s US debt burden worse than the Volcker-era shock of 1980? By one hard metric, yes. Federal interest outlays reached 3.15 percent of GDP in 2025, above the 1980-82 Volcker-era peak of roughly 2.1 to 2.5 percent, even though the current debt base is far larger relative to the economy than it was in 1980.
The Bottom Line
The mechanics here are not speculative. A record global debt stock is meeting a wave of maturities issued at rates that no longer exist, and the repricing is already visible in weaker Treasury auctions, an interest bill that has overtaken defense spending, and a debt-to-GDP interest burden that has quietly passed its Volcker-era peak. India’s experience, a weakening currency defended through costly intervention alongside a deliberate pullback from Treasuries, is a smaller-scale version of the same repricing playing out globally. Capital does not owe loyalty to any government’s balance sheet. It moves toward whatever pays for the risk it is being asked to hold, and in 2026 that logic is starting to bite.
Sources: Institute of International Finance, Reuters, Peterson Foundation, American Action Forum, CNBC, Hindustan Times, The Indian Express, Cato Institute, and S&P Global Ratings, compiled via Perplexity Deep Research, July 2026.